
Tabla de contenidos
Comprender las estadísticas
Uno de los aspectos más interesantes de PrestaShop es su capacidad para revelar información sobre el comportamiento del cliente. Vamos a ver cómo hace esto.
Contrariamente al dicho popular, que dice que "hay tres tipos de mentiras: la mentiras, las grandes mentiras y las estadísticas", las estadísticas suministradas por PrestaShop le ofrecen información sólida y fiable con la que puede contar para mejorar su tienda , cambiar la forma en la que los productos se presentan o adaptar sus precios, eliminar los productos que no se venden o hacer más visibles los que tienen más demanda. Todo esto y más se puede deducir de los datos que recoge PrestaShop automáticamente para usted, y que son presentados en una docena de entradas, jusnto con gráficas y tablas de datos que le ayudarán a tomar las decisiones más adecuadas.
El objetivo final de todo esto sigue siendo el de ayudarle a tomar las decisiones más complejas para llegar y satisfacer a su audiencia.
Además, PrestaShop cuenta con un sistema interno de gestión de asociados, lo que le permite crear fácilmente un programa de afiliación.
Estadísticas
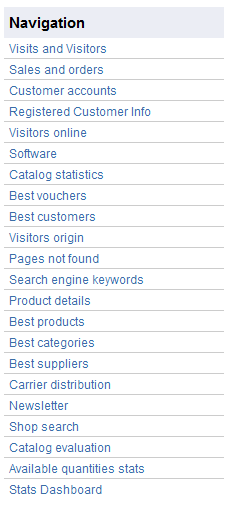
Esta sección presenta en detalle la utilidad de las diferentes estadísticas disponibles. Al hacer clic en cada una de las categorías que se encuentran a su disposición en la barra lateral izquierda de la página "Estadísticas", se recargará la parte principal de la página mostrando los números más recientes.
Para la mayoría de las estadísticas, se proporciona una explicación para que pueda comprender la información que se le presenta, y pueda utilizar estos datos en la mejora de su tienda y en su tasa de conversión.
Los datos estadísticos comienzan a recogerse en el mismo instante en el que termine de haber instalado PrestaShop. Si prefiere que los datos sean recogidos a partir de la fecha de apertura de su tienda (y por lo tanto, eliminar todos los datos recogidos durante sus pruebas), puede utilizar el "Auto-clean period" al menos 24 horas antes de la puesta en marcha definitiva. Véase más abajo.
Interfaz principal
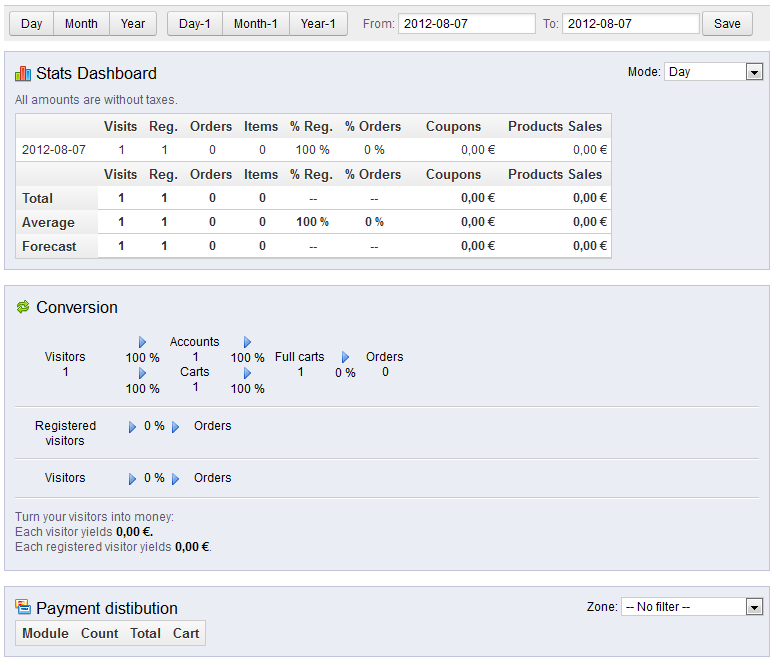
Por defecto, la página muestra la tabla de mando de las estadísticas, una visión general de los principales números recogidos por el sistema de estadísticas de PrestaShop desde que puso en marcha su tienda online.
En la parte superior de la página hay una barra que le permite elegir el período de tiempo de las estadísticas que se muestran actualmente. Tres conjuntos de opciones están disponibles:
- Día, mes o año.
- Día anterior, mes anterior o año anterior.
- Una fecha precisa.
La tabla de mando contiene 8 secciones:
- Tabla de mando de estadísticas. Este es el verdadero corazón de sus estadísticas. En una sola tabla, PrestaShop le ofrece una visión general de los números más importantes que se han recogido para el período de tiempo seleccionado: visitantes, nuevas inscripciones, nuevos pedidos, número de artículos comprados , porcentaje de registros por visitas, porcentaje de pedidos por visitas, cantidad de cupones utilizados, volumen de ventas.
Puede cambiar el nivel de detalle utilizando el selector desplegable, situado en la parte superior derecha de la sección. Los periodos de tiempo disponibles son: día, semana, mes, y año.
Las tres líneas en la parte inferior de la tabla no se ven afectadas por el período seleccionado: total, media y previsiones le ofrecen una estimación estadística de los parámetros vistos anteriormente. - Conversión. Esta sección le da una idea del valor que tiene su tienda para los visitantes y clientes registrados , en base al número de pedidos que realizan. Es un buen indicador para conocer si su tienda está o no funcionando.
- Repartición por modos de pago. Esta sección le indica los métodos de pago que están siendo más utilizados para pagar por parte de sus clientes. En base a estar cifras, debe adaptar su tienda con la finalidad de tener en cuenta los métodos más populares, e incluso destacar el método más utilizado por sus clientes.
Utilizando el selector desplegable "Zona", situado en la parte superior derecha de la sección, puede limitar los números a una zona geográfica específica, y así ver qué método funciona mejor o peor en cada región. - Repartición por categorías. Esta sección proporciona información específica de cada categoría. Para cada categoría, esta le presenta números que le serán de utilidad: productos, ventas, porcentaje de productos dentro de todo su catálogo, porcentaje de las ventas de toda la tienda, precio medio de los productos. Si nota que una categoría es mucho más éxitosa que otras, es posible que desee poner todos sus esfuerzos en promocionarla. Por otro lado, también podría intentar rmejorar los números de las categorías menos éxitosas creando para ellas cupones de descuento o realizando otros actos promocionales...
Utilizando el selector desplegable "Zona", situado en la parte superior derecha de la sección, puede limitar los números a una zona geográfica específica, y así ver qué categorías funcionan mejor o peor en cada región. - Repartición por idiomas. Sus clientes pueden elegir su idioma preferido cuando se registran en su tienda, y usted puede ver la distribución de los idiomas desde esta sección. Asegúrese de tener todos sus productos traducidos correctamente por lo menos para los dos idiomas más utilizados por sus clientes.
- Repartición por zonas. Puede filtrar las otras secciones por zona geográfica, y esta sección le da una visión general por zonas del número de clientes registrados y ventas realizadas (y sus respectivos porcentajes).
- Repartición por divisas. Si acepta más de una moneda, esta sección le ayuda a saber cuál es la más utilizada por los clientes a la hora de pagar.
Utilizando el selector desplegable "Zona", situado en la parte superior derecha de la sección, puede limitar los números a una zona geográfica específica, y así conocer qué divisa es la más utilizada en cada región. - Repartición de las ventas por atributos. Esto es más una estadística interna, que le permite saber qué atributo y grupos de atributos son los más utilizados en sus productos.
Navegando por las estadísticas
La mayoría de las estadísticas se pueden descargar en archivos CSV, haciendo clic en el botón "CSV Export".
- Visitas y visitantes. Esta página le proporciona estadísticas sobre los visitantes de su tienda y el número de veces que estos visitan su tienda. Cuanto mayor sea el número, más popular será su tienda. La gráfica le ayuda a cpnocer el comportamiento de sus visitantes. Basicamente podrá ver el número de visitas que su tienda ha tenido, y podrá comparar este dato con el número de visitantes (PrestaShop puede reconocer cuando la misma persona visita su tienda varias veces, de ahí que el número de visitas será mucho más alto que el número de visitantes). Si la diferencia entre estos dos números es alta, significa que usted tiene una base de clientes leales.
- Ventas y pedidos. Estas dos gráficas presentan la evolución de las ventas y pedidos de su tienda. Estas pueden ser filtradas por países, utilizando el menú desplegable situado en la parte superior derecha.
- La primera gráfica indica the total number of valid orders, as well as the total number of products ordered. With this graph, you can analyze which periods gave you the biggest return in terms of quantity of orders.
- The second graph helps you visualize your sales graphically. It can analyze the periods of time when you had the greatest sales. This enables you, for instance, to have a better idea of when to start your marketing campaigns.
- Cuentas cliente. This page displays a graph with the number of customer accounts created in your online shop. With this information, you can measure the impact of your marketing campaigns. You can see the number of visitors who subscribed but actually never purchased anything, as well as the number of customers who created an account and bought an item immediately after registering.
- Información de clientes registrados. This section is divided into 5 charts.
- Distribución por género. You can see how your customers are distributed among the various social titles that you have set – by default, Mr., Ms. and Miss, but there can be many others, such as Dr. or Sr. Therefore, you cannot trust this graph to show you the gender distribution... unless you have reduced your social titles to just two gendered ones.
- Rango de edades. You can learn about the distribution of your customers according to their age. If you see that the age range of your customers is not what you imagined it would be, think about adjusting your marketing approach.
- Distribución por paises. You can quickly consult in which countries your customers are living. This can help you focus marketing efforts on a single country.
- Distribución por divisas. You can see what currencies are used to shop for items in your shop, and in what proportions.
- Distribución por idiomas. You can see in what languages your shop is consulted most often, and thus decide whether or not you should improve your shop's translations in a given language.
- Visitantes en línea. This section indicates the number of visitors currently on your shop. You can see their names and the pages that they are currently looking at. The data is updated live, as visitors browse your shop.
- Software. This section informs you of the web browsers that visitors and customers use to browse your shop. You should verify that your shop is perfectly compatible with these browsers, or at least the three most popular ones. It also tells you if visitors are browsing your shop from their mobile devices (such as a smart-phone). If this number is significant, you should think of having a mobile version of your shop.
Finally, you can see what operating systems your visitors are using. Make sure that your shop is fully compatible with all of your visitors' platforms. - Mejores cupones de descuento. This section displays the most popular coupons, vouchers, cart rules and catalog price rules that you created and distributed, whether personally or through a promotional campaign. The table also displays the turnover, and the number of coupons used.
- Catálogo de estadísticas. This section contains practical information on the products sold in your online shop, and your catalog as a whole. The figures can be filtered by category using the drop-down selector at the top right of the section. You can act on your catalog's performance by considering the following indicators:
- Productos disponibles. The amount of available products in this category (by default, all categories).
- Precio medio (precio base). Average product price in the selected category.
- Páginas del producto vistas. Number of pages that were visited by your potential customers. Compare this data between different categories to see which has the most product views, or on the contrary which ones do not attract many customers. Use this information to make some improvements in your catalog.
- Productos comprados. The amount of products purchased in each category.
- Número medio de páginas visitadas. The global number of visits for the products in the selected category.
- Número medio de compras. The global return for the product sales in the selected category.
- Imágenes disponibles. Indicates how many images are tied to the selected category's products. A quick way to know if some products lack images is when there are fewer images as there are products.
- Número medio de imágenes. Number of images divided by the number of products in the selected category.
- Productos nunca vistos. Some of your products might never have been viewed by visitors. Check their pages to try and understand why.
- Productos nunca comprados. Some of your products have never been bought by customers. This is a serious issue, and you should take time to understand why.
- Ratio de conversión. Indicates the relationship between the number of visitors and the number of purchases. It is important that this value be as high as possible.
- A table at the bottom of the page tells you what products in this category have never been purchased. You may want to consider changing their price or writing a more attractive description.
- Mejores clientes. This section lists the best customers in your shop. It displays their e-mail address, as well as the number of time they have visited the website, and how much they have spent so far. Keep an eye on this page in order to keep track of, and take care of, your best customers. By clicking on the buttons at the top of the columns, you can choose how you would like to sort this data.
- Procedencia de los visitantes. This page uses a graph to give you the top ten sites and search engines that have sent visitors to you. Usually, search engines play a very important role. If you create a marketing campaign by publishing articles on other sites, you can see what impact it had on your shop. Below the graph are the names of the sites that brought you your audience, with the number of visitors from each on the right hand column.
- Páginas no encontradas. This page tells you which pages of your catalog people have attempted to access but could not find (resulting in what is called "HTTP 404" errors). This is useful for finding potential technical problems that may hinder your sales.
- Palabras claves en los motores de búsqueda. This page tells you what keywords typed into a search engine brought visitors to your online shop. This enables you to know which terms make your shop easily identifiable. Conversely you can see which keywords are absent from this list, and are thus not effective.
- Detalles del producto. This page shows you all the products in your shop by the reference number, name, and available stock. You can sort your results by selecting from the drop-down menu above the product category you want to view. Click on a product to access its statistics. You can then view a chart with two sets of data: sales made and number of visits to the product page. The conversion rate of the product will also be displayed.
- Mejores productos. This section displays your best performing products. You can view the turnover achieved, the average daily sales, number of page views, and the quantity left in your current stock. With this table, you can identify your core products and decide whether to perform actions such as increasing or decreasing your prices or giving discounts on a specific product.
- Mejores categorías. This section presents your shop's performance by category. You can find out how many products in each category have been sold, the revenue generated, and the number of pages viewed. Make sure to regularly check the consistency of your results between different categories in order to adjust your shop's cohesiveness.
- Mejores proveedores. This section gives statistics on your suppliers by providing the quantities sold and the revenue generated.
- Distribución transportista. This page indicates which carriers are used most by your visitors. You can filter all results by order status. If you learn that a carrier is not often used, despite being fast and efficient, it might be appropriate to display it more prominently during checkout, to increase customer satisfaction.
- Newsletter (Boletín de noticias). This page displays newsletter subscription statistics. You can use this database to keep customers informed. The newsletters usually help increase traffic to your shop. If you want to improve subscription, consider adding coupons/voucher/cart rules codes to each newsletter. You can see all of your subscribers' addresses via the "Newsletter" module, in the "Modules" page.
- Búsqueda de la tienda. This section presents two indicators.
- The first one is a chart which shows the distribution of keywords typed into your shop's search bar. This allows you to see which products your visitors are most looking for – and therefore, the one you should have plenty of stock of.
- The second is a table summarizing your visitors' searches. You can see which keywords are being used, how often they were typed, and how many results were available. It is important that all of your customers' requests get a result. To improve your shop, be sure to add the products that meet the customers' demands (searches) or add additional tags to your products that are easily identifiable.
- Evaluación del catálogo. This section gives an overview of your catalog's performance. You can find out if each product is active, or if its description is correctly entered in all of your shop's active languages. You can also see if all your products have enough images their sales performance, and current stock status. The overall score for each product is displayed using a colored icon. You can define your criteria by filling in the table at the top of the page, then saving your settings.
- Estadísticas de las cantidades disponibles. This section gives you an overview of the value of your current stock.
- Tabla de mando de estadísticas. This is the stats homepage itself. It presents a bird's eye view of you shop's stats. Clicking this last option simply takes you back to the global stats dashboard.
Configuración
PrestaShop's stats page can be configured to have the look-and-feel that you prefer.
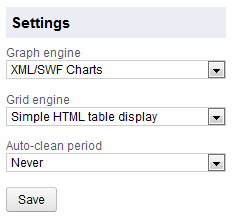
Graph engine
A graph can take several forms, depending on your preferences. With the "Graph engine" setting, you can choose with which graph engine your statistics should be presented. This does not change your statistics, only the way they are presented, so simply choose the one you prefer. You can currently choose between these four:
- Visifire. This engine relies on Microsoft technologies to display its graphs: Silverlight, WPFR, Windows Phone... You will need to install the Silverlight browser plugin to make it work. Learn more at http://www.visifire.com/.
- XML / SWF Charts. A free and complete engine, which uses Flash to display its graphs. You will need the Flash browser plugin installed. Learn more at http://www.maani.us/xml_charts/.
- Google Chart. A great engine, which uses the latest browser technologies to display its graphs: HTML5, SVG, JavaScript. No plugin requires. Learn more at https://developers.google.com/chart/.
- Artichow. An old and public domain engine, which does the basic job for most types of graphs.
More can be added, using modules. See the Addons marketplace to find more options: http://addons.prestashop.com/en/63-analytics-stats.
You can thus make a display choice that is both aesthetically pleasing and compatible with your browser.
PrestaShop uses the free version of XML/SWF Chart. Therefore, when you click a graph made with this engine, a new browser page will open with the XML/SWF Chart official website: http://www.maani.us/xml_charts/.
Grid engine
The way data tables are presented can also be configured. The default installation of PrestaShop only has one engine available: "Simple HTML table display". But you can install modules to your shop that offer more feature than the default engine. See the Addons marketplace to find more options: http://addons.prestashop.com/en/63-analytics-stats.
Auto-clean period
You can also automatically select the way the statistics will be erased from your shop. Erasing data will usually make the shop more responsive, and thus improve the comfort of your visitors. You have four options, depending on your traffic and your server's performance: Never, Week, Month or Year.
This option can be very useful to clean the statistical data that was gathered during your tests of the shop, and thus only keep the data starting from the real opening of your shop.
Search Engines
A lot of you visitors will come from search engines. In order to know what they were looking for, and how you can improve your shop for their search queries, you need to know their queries.
This page presents a table of all the search engines that your installation of PrestaShop supports – meaning that PrestaShop is able to recognize it, and to extract the query that the visitor from that a given search engine used to find your shop.
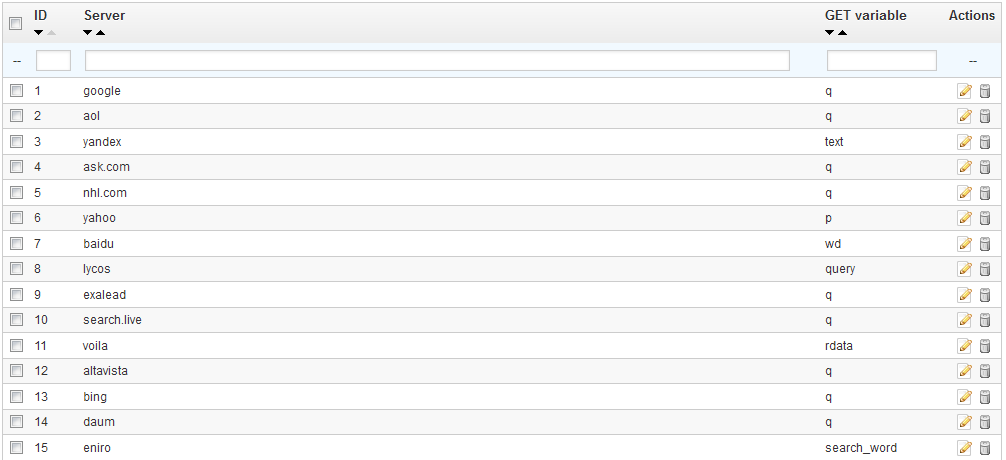
While Google has the biggest share of search engines users, there are many other search engines that people could use to find your website. Therefore, you have to be able to retrieve their search requests too. When an unknown search engine is starting to bring regular visitors, it is high time that you add it to your database – otherwise, those visitors would be marked in your statistics as coming from "Other search engines", which is not helpful at all.
Adding a Search Engine
It is very simple to add a new search engine to your list.
Let's say you want to add DuckDuckGo, a search engine that emphasizes its respect for data privacy:
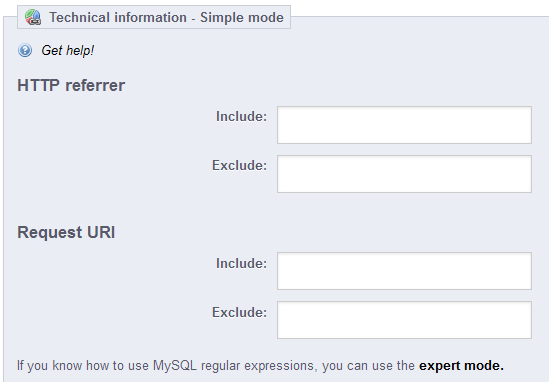
- Get the full referrer URL for the search. For instance, http://duckduckgo.com/?q=kids+shoes
- Take the domain name, which is specific to that search engine, and put it in the "Server" field. In our case, "duckduckgo".
- Find the query variable:
- Find the query string. It should be a set of letters, followed by an "=" sign, followed by the query itself, closed by a "&" or the end of the string. In our case, it is "q=kids+shoes".
- The query variable is the set of letters before the "=" sign. In our case: "q". Put that in the "$_GET variable" field.
- Click the "Save" button, and from now on, PrestaShop will be able to recognize visitors from DuckDuckGo.
Referrers
A referrer means a website that brings you at least one visitor. This website features a link to your shop, and thus it helps you build an audience and eventually make more sales.
Some referrers are more important to you than others: you might have partners that have links to your shop on their own website, and both you and your partners would certainly want to know how many visitors those links brought you. You could even pay your partners to display a link to your shop, depending on how much you value your traffic.
This, in effect, is called affiliation, and the "Referrers" page helps you build a complete affiliate program, to which even your partner can connect to see the number of visits and sales their links have generated. Registered affiliates generate traffic to your shop, you want to reward them for those visitors, and the affiliate program is how both of you can access the figures the reward is based on.
PrestaShop's referrer tool can be likened to that of a statistical dashboard open to others than only your staff members. When you create an affiliate campaign for a site, you can grant that site access to all of the activity it will have made for your site, through a password-protected URL: http://URL-OF-YOUR-SHOP.com/modules/trackingfront/stats.php.
Adding a new referrer
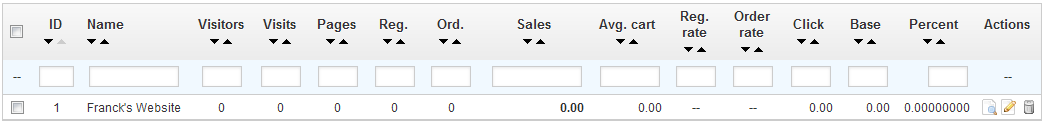
The affiliate space enables you to create privileged access for your partners. They will have access to all statistics on the flow of visitors from their site to your online shop. To create their privileged space, you need to create their account in your affiliation program, then define how you will pay based on traffic and sales generated.
To create a new affiliate partner, click on the "Add new" button, which will take you to the affiliate creation form.
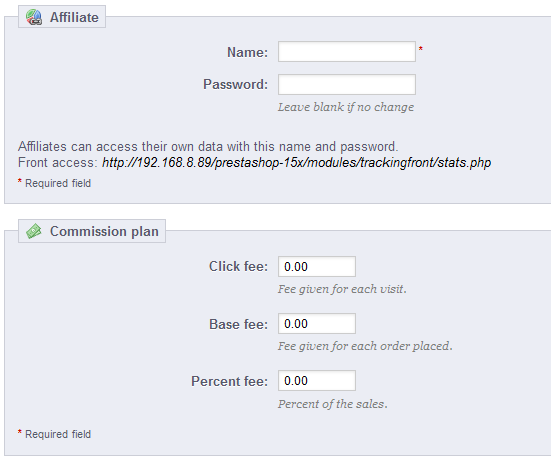
Each section is important:
- Affiliate. The account of the partner in your affiliation program.
- Name. To connect to your affiliation back-office, your partner needs a login name; you can use a simple name or an e-mail, but make sure to use something both you and your partner can remember easily.
- Password. The first time you create the account, PrestaShop saves the password along the login name. When you need to edit the account (for instance, when needing to change the commission), the password will be blank. This does not mean there is no password; if you fill the blank field when editing the account, it will change the password.
- Commission plan. This is where you indicate the fees of your affiliate – meaning the money you will owe your partner for actions of visitors from their site.
- Click fee. This defines how much you estimate a visitor from this partner's site is worth. Every time a visitor from your partner's site comes to your shop by clicking on their link, the partner earns the marked amount.
- Base fee. You can also reward your partners if visitors from their sites do buy one of your products. Note that this is only valid if the purchase is made during the browsing session that follows the click on the partner's link.
- Percent fee. In addition to the base fee, or as a replacement, you can reward partners with a percentage of the sales made during the browsing session of visitors from their sites.
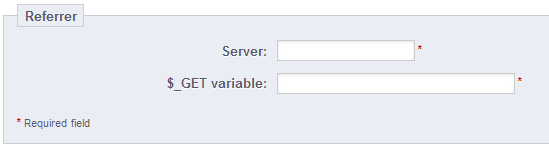
- Technical information - Simple mode. This is very important, as this is what will make the system differentiate this partner from other referrer links. Once configured, you should make a couple of test in order to make sure that you are indeed tracking the affiliate correctly.
- HTTP referrer. In the "Include" field, set the partner's domain name that you want to track as your affiliate domain.
- Request URI. In the "Include" field, set the last part of the query string. The system will track referrers that use a special query string. For instance, you can track referrers that use the
?prestaff=argument in their URL. This can help you further differentiate referrers.
- Technical information - Expert mode. While the simple mode matches words using MySQL's "LIKE" function, the expert mode enable you to use MySQL regular expressions. This can prove very powerful but also very hard to maintain. Be sure to master the subject of regular expressions before putting anything in these fields.
The "Help" section gives you some precious indications on how to best configure your affiliate. Read it through.
Settings
The referrer settings are mostly tools to help you make the best of your affiliate program.
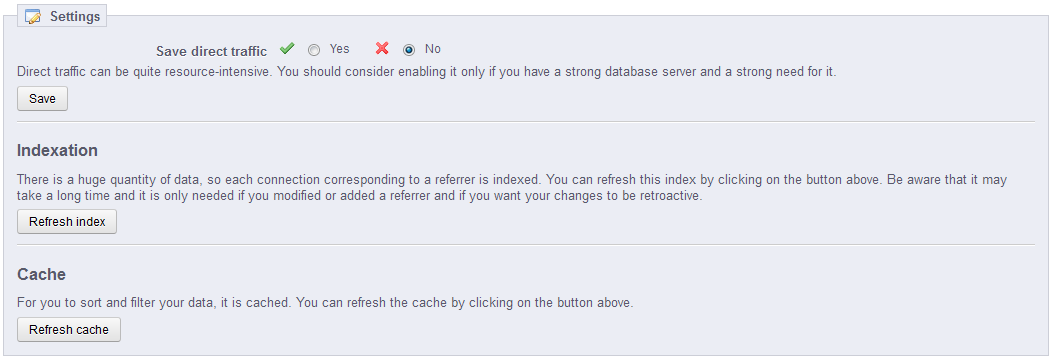
There are three possibilities:
- Save direct traffic. Direct traffic represents visitors who arrive on your shop directly, by typing your URL in their browser. While these are important because they are visitor who really know about your shop and are interested in your products (contrary to visitors with referrer, who might have simply stumble upon your shop by chance), saving this traffic can put a huge toll on your database. This is why this traffic is not saved nor analyzed by default. Only enable this option if you know what you are doing.
- Indexation. The "Refresh index" button is necessary when you add a new referrer and you want to analyze your past traffic for this new referrer.
- Cache. PrestaShop caches the data it gathers. You can use this button to regularly refresh your data cache.