...
Esta sección presenta en detalle la utilidad de las diferentes estadísticas disponibles. Al hacer clic en cada una de las categorías que se encuentran a su tu disposición en la barra lateral izquierda de la página "Estadísticas", se recargará la parte principal de la página mostrando mostrándote sus números más recientes.
Para la mayoría de las estadísticas, se proporciona una explicación para que pueda puedas comprender la información que se le te presenta, y pueda utilizar puedas utilizar estos datos en la mejora de su tu tienda y en su tu tasa de conversión.
| Tip | ||
|---|---|---|
| ||
|
Interfaz principal
La página muestra el cuadro de mando de las estadísticas, una visión general de los principales números recogidos por el sistema de estadísticas de PrestaShop desde que puso en marcha su tu tienda en línea.
En la parte superior de la página hay una barra que le te permite elegir el periodo de tiempo de las estadísticas que se muestran actualmente. Tres conjuntos de opciones están disponibles:
- Día, mes o año actual.
- Día, mes o año anterior.
- Selección precisa de un período de tiempo (desde y hasta).
Haga Haz clic en "Guardar" para mostrar las estadísticas del período de su tu elección.
El cuadro de mando contiene 8 secciones:
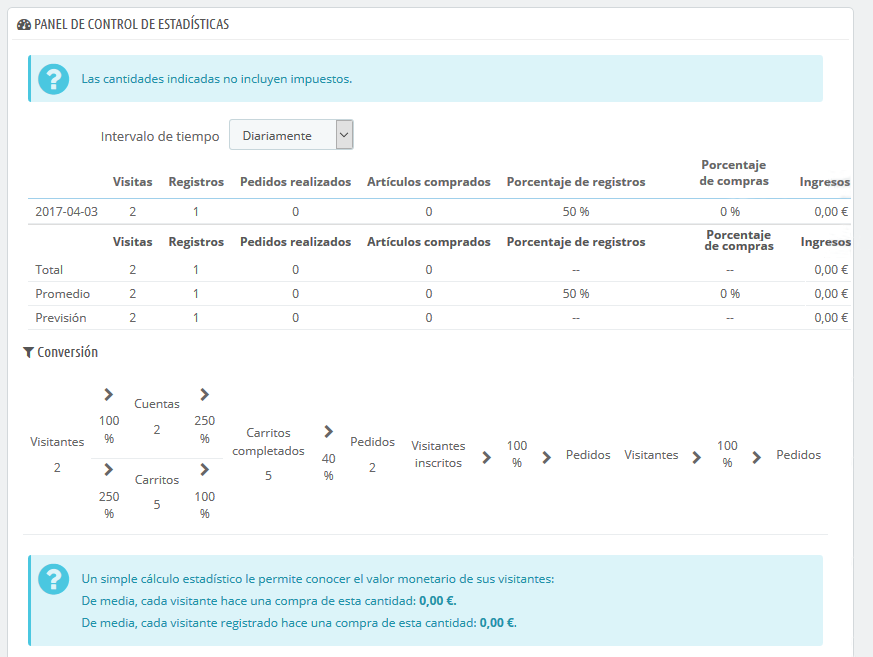
- Las principales estadísticas. Este es el verdadero corazón de sus tus estadísticas. En una sola tabla, PrestaShop le te ofrece una visión general de los números más importantes que se han recogido para el período de tiempo seleccionado: visitantes, nuevas inscripciones, nuevos pedidos, número de artículos comprados, porcentaje de registros por visitas, porcentaje de pedidos por visitas,
cantidad de cupones de descuentos utilizados, volumen de ventas.
Puede Puedes cambiar el nivel de detalle detalle utilizando el selector desplegable, situado en la parte superior derecha de la sección. Los periodos de tiempo disponibles son: día, semana, mes, y año.
Las tres líneas en la parte inferior de la tabla no se ven afectadas por el período seleccionado: total, media y previsiones le te ofrecen una estimación estadística de los parámetros vistos anteriormente. - Conversion. This section gives you an idea of how much a visitor or a registered customer are worth on your shop, based the number of orders they place, basically. It is a nice indicator of how your shop is doing.
Note: the difference between a "cart" and "full cart" is that a cart is a visitor's cart, with products and not much else, while a full cart is a cart with products AND a shipping address AND a chosen carrier -- in short, the cart has been almost fully through the checkout process, all that's left to do is actually pay for it all. - Payment distribution. This section presents which payment methods are most often chosen by your paying customers. Based on these figures, you may wish to adapt your shop or your business in order to better cater for the most popular methods, or to push forward a specific method that you would prefer that your customers choose.
Using the "Zone" drop-down selector at the top right of the section, you can limit the numbers to a specific geographical zone, and thus see which method works best or worst depending on the region. - Category distribution. This section gives category-specific information. For each category, it presents you with useful numbers: products, sales, percentage of product sold for the whole shop, percentage of sales for the whole shop, average product price. If you notice that a category is way more successful than others, you might want to push your promotion efforts on it. On the other hand, you could try bolstering the figures of disappointing categories by releasing vouchers or other doing other promotional actions...
Using the "Zone" drop-down selector at top right of the section, you can limit the numbers to a specific geographical zone, and thus see which category is most successful depending on the region. - Language distribution. Your customers can choose their preferred language when browsing your site, and you can see the language distribution with this section. Make sure to have all your products correctly translated for at least the two most popular languages.
- Zone distribution. You can filter other section by zones, and this section directly gives you a per-zone run down of your number of registered customers and placed sales (and their respective percentages).
- Currency distribution. If you accept more than one currency, this section helps you see which one is the most used by your paying customers.
Using the "Zone" drop-down selector at the top right of the section, you can limit the numbers to a specific geographical zone, and thus see which currency is most successful depending on the region. - Attribute distribution. This is more of an internal statistic, enabling you to see which attribute and attribute group is the most used within your products.
Navigating the statistics
| Tip |
|---|
Most of the statistical data can be downloaded as CSV files, by clicking on the "CSV Export" button at the bottom of the page. |
...
| Column |
|---|
...
- Available quantities. This section gives you an overview of the value of your current stock.
- Best categories. This section presents your shop's performance by category. You can find out how many products in each category have been sold, the revenue generated, and the number of pages viewed. Make sure to regularly check the consistency of your results between different categories in order to adjust your shop's cohesiveness.
- Best customers. This section lists the best customers of your shop. It displays their email address, as well as the number of times they have visited the website and how much they have spent so far. Keep an eye on this page in order to keep track of, and take care of, your best customers. By clicking on the buttons at the top of the columns, you can choose how you would like to sort this data.
- Best suppliers. This section gives statistics on your suppliers by providing the quantities sold and the revenue generated.
- Best vouchers. This section displays the most popular coupons, vouchers, cart rules and catalog price rules that you created and distributed, whether personally or through a promotional campaign. The table also displays the turnover, and the number of vouchers used.
- Best-selling products. This section displays your best-performing products. You can view the turnover achieved, the average daily sales, the number of page views, and the quantity left in your current stock. With this table, you can identify your core products and decide whether to perform actions such as increasing or decreasing your prices or giving discounts on a specific product.
- Browsers and operating systems. This section informs you of the web browsers that visitors and customers use to browse your shop. You should verify that your shop is perfectly compatible with these browsers, or at least the three most popular ones. It also tells you if visitors are browsing your shop from their mobile devices (such as smartphones). If this number is significant, you should think of having a mobile version of your shop.
Finally, you can see what operating systems your visitors are using. Make sure that your shop is fully compatible with all of your visitors' platforms. - Carrier distribution. This page indicates which carriers are used most by your visitors. You can filter all results by order status. If you learn that a carrier is not often used, despite being fast and efficient, it might be appropriate to display it more prominently during checkout, to increase customer satisfaction.
- Catalog evaluation. This section gives an overview of your catalog's performance. You can find out if each product is active, or if its description is correctly entered in all of your shop's active languages. You can also see if all your products have enough images, their sales performance, and current stock status. The overall score for each product is displayed using a colored icon. You can define your criteria by filling in the table at the top of the page, then saving your settings.
- Catalog statistics. This section contains practical information on the products sold in your online shop, and your catalog as a whole. The figures can be filtered by category using the drop-down selector at the top of the section. You can act on your catalog's performance by considering the following indicators:
- Products available.The amount of available products in this category (by default, all categories).
- Average price. Average product price in the selected category.
- Product pages viewed.Number of pages that were visited by your potential customers. Compare this data between different categories to see which has the most product views, or on the contrary which ones do not attract many customers. Use this information to make some improvements in your catalog.
- Products bought.The amount of products purchased in each category.
- Average number of page visits. The global number of visits for the products in the selected category.
- Average number of purchases. The global return for the product sales in the selected category.
- Images available. Indicates how many images are tied to the selected category's products. A quick way to know if some products lack images is when there are fewer images as there are products.
- Average number of images.Number of images divided by the number of products in the selected category.
- Products never viewed. Some of your products might never have been viewed by visitors. Check their pages to try and understand why.
- Products never purchased. Some of your products have never been bought by customers. This is a serious issue, and you should take time to understand why.
- Conversion rate. Indicates the relationship between the number of visitors and the number of purchases. It is important that this value should be as high as possible.
- A table at the bottom of the page tells you what products in this category have never been purchased. You may want to consider changing their price or writing a more attractive description for instance.
- Customer accounts. This page displays a graph with the number of customer accounts created in your online shop. With this information, you can measure the impact of your marketing campaigns. You can see the number of visitors who subscribed but actually never purchased anything, as well as the number of customers who created an account and bought an item immediately after registering.
- Newsletter. This page displays newsletter subscription statistics. You can use this database to keep customers informed. The newsletters usually help increase traffic to your shop. If you want to improve subscription, consider adding voucher/cart rules codes to each newsletter. You can see all of your subscribers' addresses via the "Email subscription" module, in the "Modules & Services" page.
...
- Gender Distribution. You can see how your customers are distributed among the various social titles that you have set – by default, Mr. and Mrs., but there can be many others, such as Dr. or Sr. Therefore, you cannot trust this graph to show you the gender distribution... unless you have reduced your social titles to just two gendered ones.
- Age Ranges. You can learn about the distribution of your customers according to their age, provided you request their birthdate. If you see that the age range of your customers is not what you imagined it would be, think about adjusting your marketing approach.
- Country Distribution. You can quickly consult in which countries your customers are living. This can help you focus marketing efforts on a single country.
- Currency Distribution. You can see what currencies are used to shop for items in your shop, and in what proportions.
- Language Distribution. You can see in what languages your shop is consulted most often, and thus decide whether or not you should improve your shop's translations in a given language.
...
- The first graph indicates the total number of valid orders, as well as the total number of products ordered. With this graph, you can analyze which periods gave you the biggest return in terms of quantity of orders.
- The second graph helps you visualize your sales graphically. It can analyze the periods of time when you had the greatest sales. This enables you, for instance, to have a better idea of when to start your marketing campaigns.
...
- The first one is a chart which shows the distribution of keywords typed into your shop's search bar. This allows you to see which products your visitors are most looking for – and therefore, the one you should have plenty of stock of.
- The second is a table summarizing your visitors' searches. You can see which keywords are being used, how often they were typed, and how many results were available. It is important that all of your customers' requests get a result. To improve your shop, be sure to add the products that meet the customers' demands (searches) or add additional tags to your products that are easily identifiable.
...
- Conversión. Esta sección te da una idea del valor que tiene tu tienda para los visitantes y clientes registrados, en base al número de pedidos que realizan. Es un buen indicador para conocer si tu tienda está o no funcionando.
Nota: la diferencia entre un "carrito" y un "carrito completado" es que un carrito es un carrito de un visitante, con productos y no mucho más, mientras que un carrito completo es un carrito con productos Y una dirección de envío Y un transportista seleccionado - en resumen, el carrito ha realizado casi completamente el proceso de pago, y lo único que le queda realmente por hacer es pagar. - Distribución por métodos de pago. Esta sección presenta los métodos de pago que están siendo más utilizados para pagar por parte de tus clientes. En base a estar cifras, debes adaptar tu tienda con la finalidad de tener en cuenta los métodos más populares, e incluso destacar el método más utilizado por tus clientes.
Utilizando el selector desplegable "Zona", puedes limitar los números a una zona geográfica específica, y así ver qué método funciona mejor o peor en cada región. - Distribución por categorías. Esta sección proporciona información específica de cada categoría. Para cada categoría, ésta te presenta números que te serán de utilidad: productos, ventas, porcentaje de productos dentro de todo tu catálogo, porcentaje de las ventas de toda la tienda, precio medio de los productos. Si notas que una categoría es mucho más exitosa que otras, es posible que desees poner todos tus esfuerzos en promocionarla. Por otro lado, también podrías intentar mejorar los números de las categorías menos exitosas creando para ellas cupones de descuento o realizando otras acciones promocionales.
Utilizando el selector desplegable "Zona", puedes limitar los números a una zona geográfica específica, y así ver qué categorías funcionan mejor o peor en cada región. - Distribución por idiomas. Tus clientes pueden elegir su idioma preferido cuando se registran en tu tienda, y tu puedes ver la distribución de los idiomas desde esta sección. Asegúrate de tener todos tus productos traducidos correctamente por lo menos para los dos idiomas más utilizados por tus clientes.
- Distribución por zonas. Puedes filtrar las otras secciones por zona geográfica, y esta sección te proporcionará una visión general por zonas del número de clientes registrados y ventas realizadas (y sus respectivos porcentajes).
- Distribución por monedas. Si aceptas más de una moneda, esta sección te ayuda a saber cuál es la más utilizada por los clientes a la hora de pagar.
Utilizando el selector desplegable "Zona", puedes limitar los números a una zona geográfica específica, y así conocer qué divisa es la más utilizada en cada región. - Distribución por atributos. Esta es más una estadística interna, que te permite saber qué atributo y grupos de atributos son los más utilizados en tus productos.
Navegando por las estadísticas
| Tip |
|---|
La mayoría de las estadísticas se pueden descargar en archivos CSV, haciendo clic en el botón "Exportar CSV". |
| Section | ||||
|---|---|---|---|---|
|